Welcome to
East Garfield Park Chicago Real Estate & Lifestyle
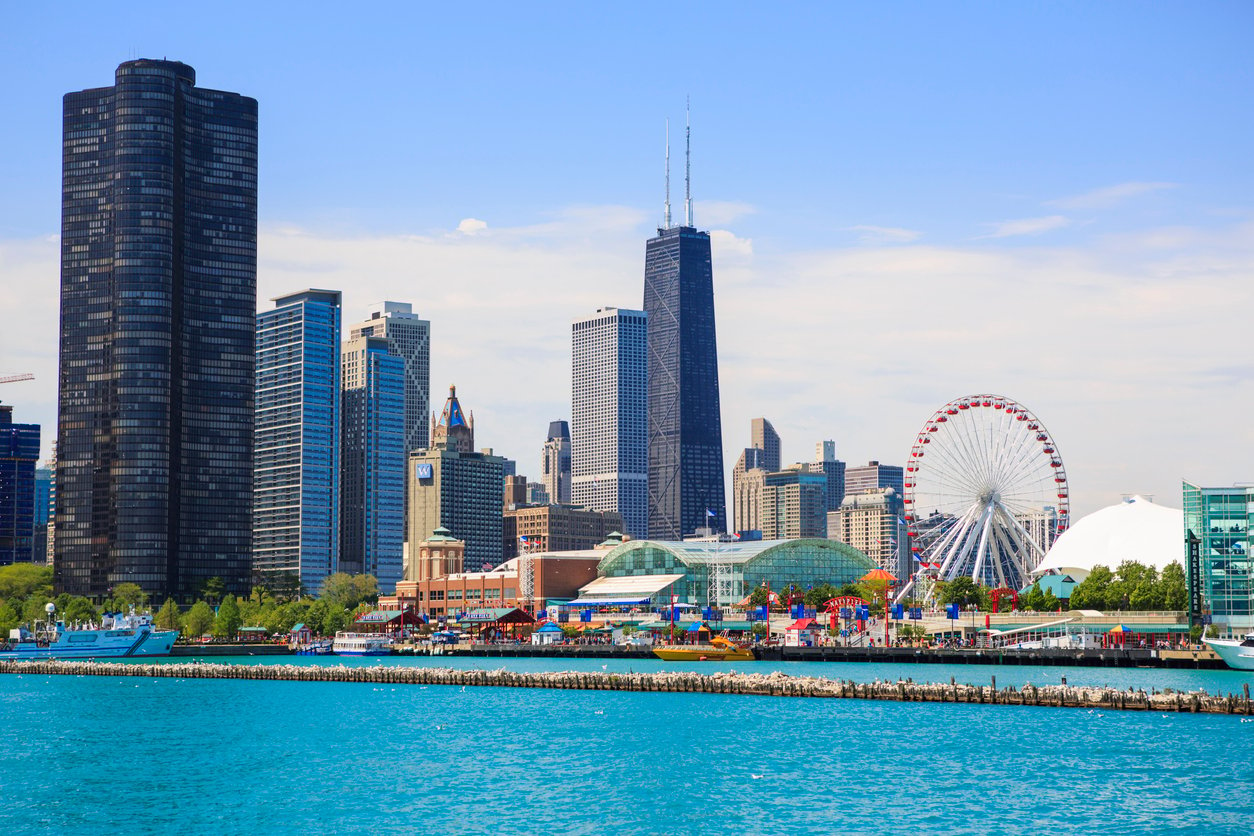
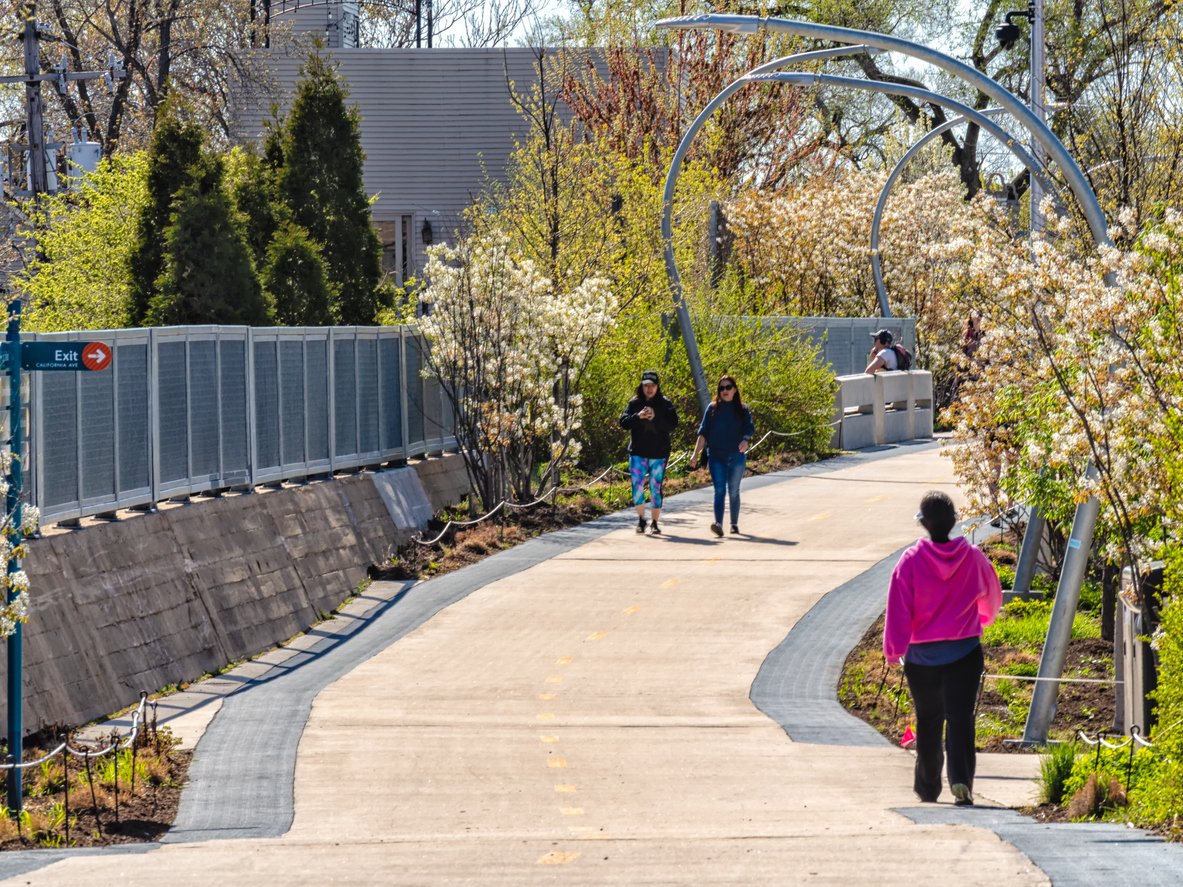
Home of the Garfield Park Conservatory, historic boulevards and greystones, and Green Line access to the Loop.
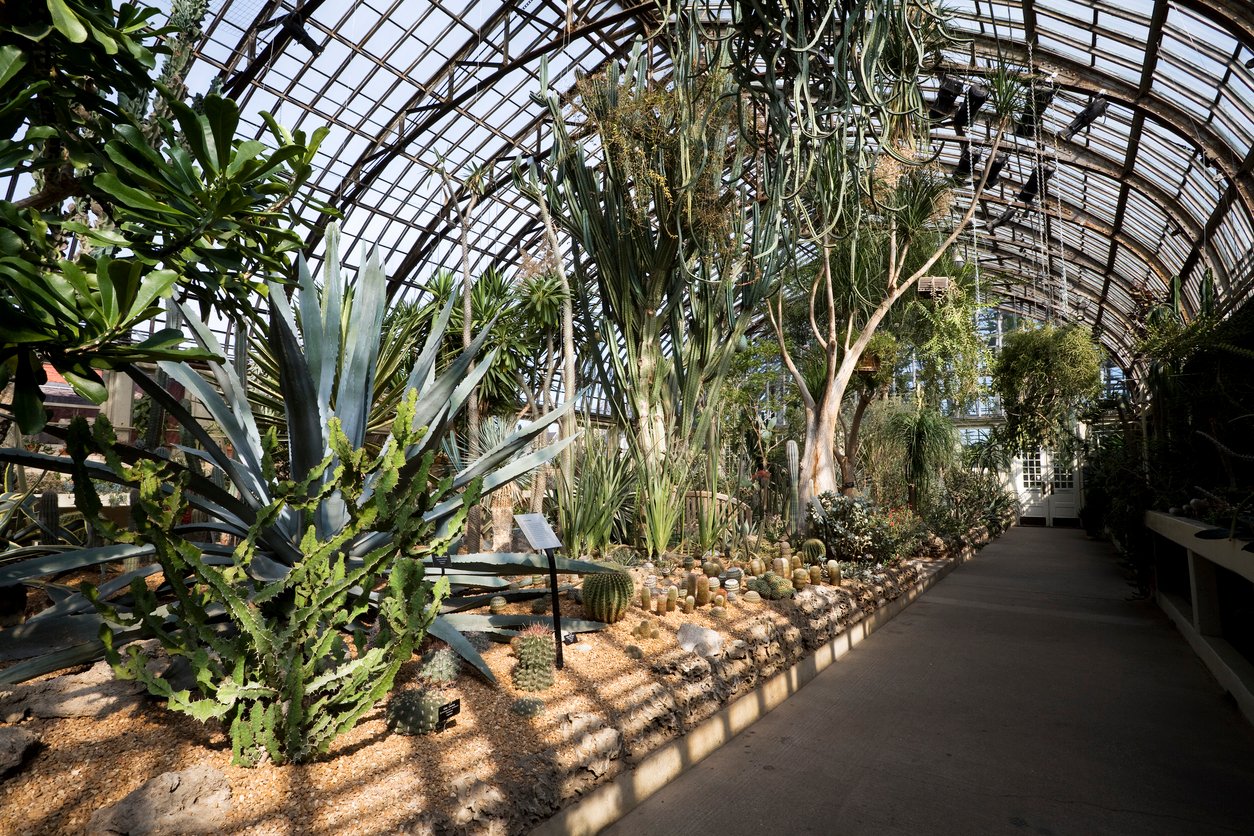
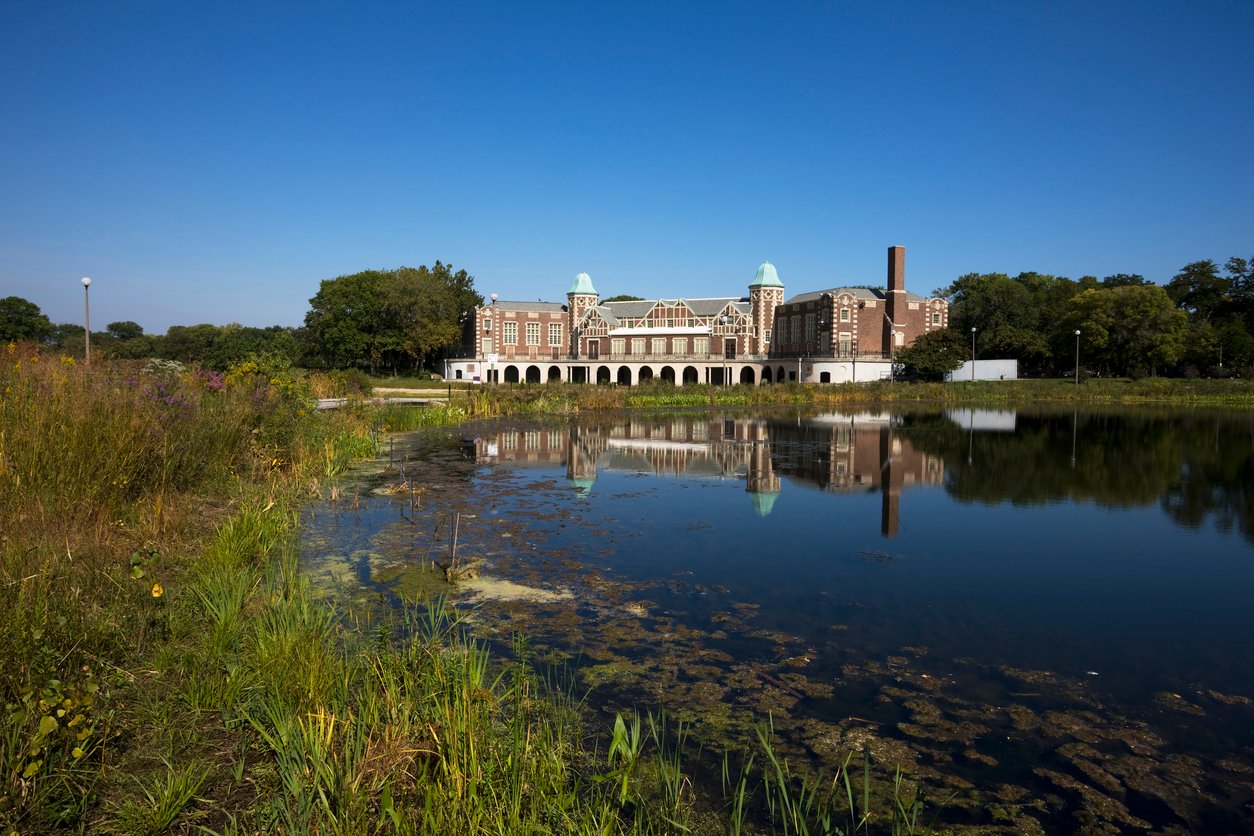
East Garfield Park is home to one of Chicago's true treasures: the Garfield Park Conservatory, among the largest conservatories in the nation — acres of landscape art under glass, from the Palm House to the Fern Room, free to enter and beloved across the city. It sits inside Garfield Park itself, whose golden-domed field house is one of the most recognizable park buildings in Chicago, surrounded by lagoons and 180 acres of green space.
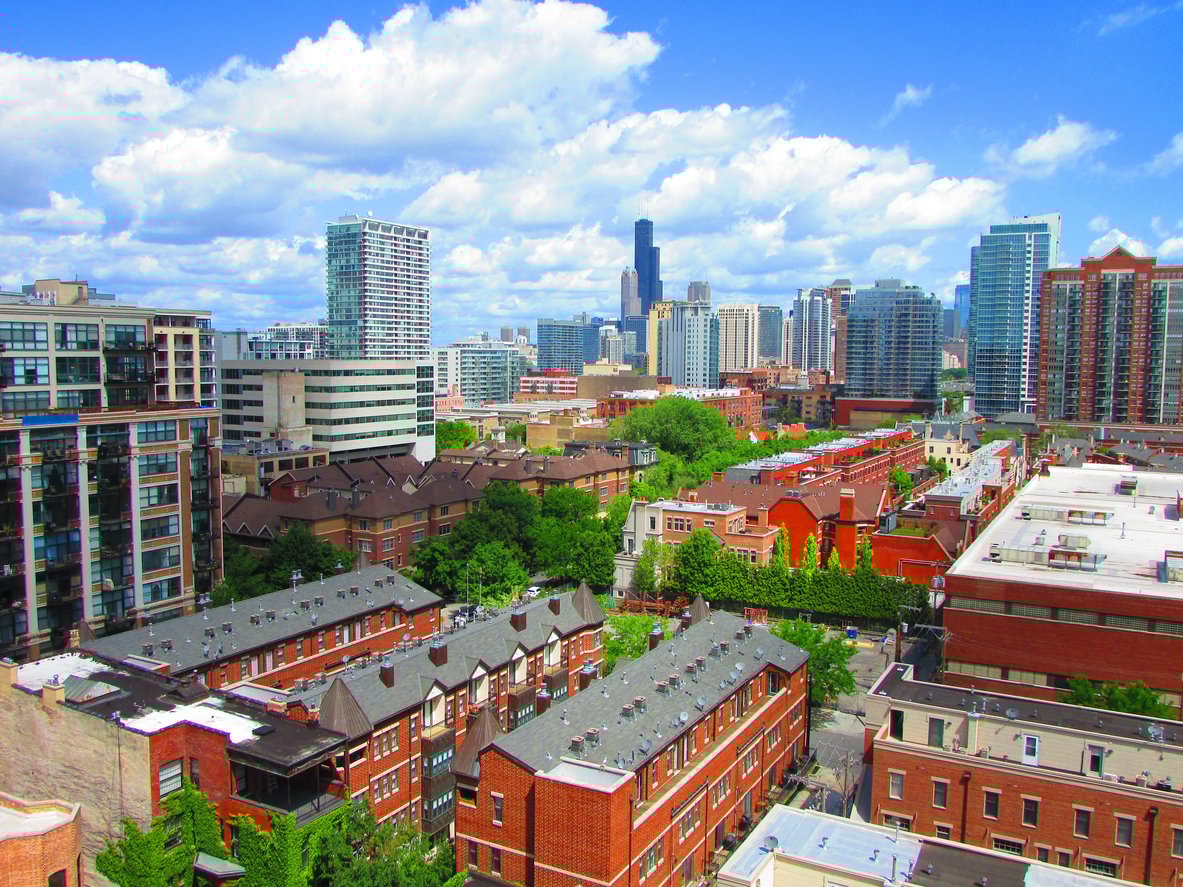
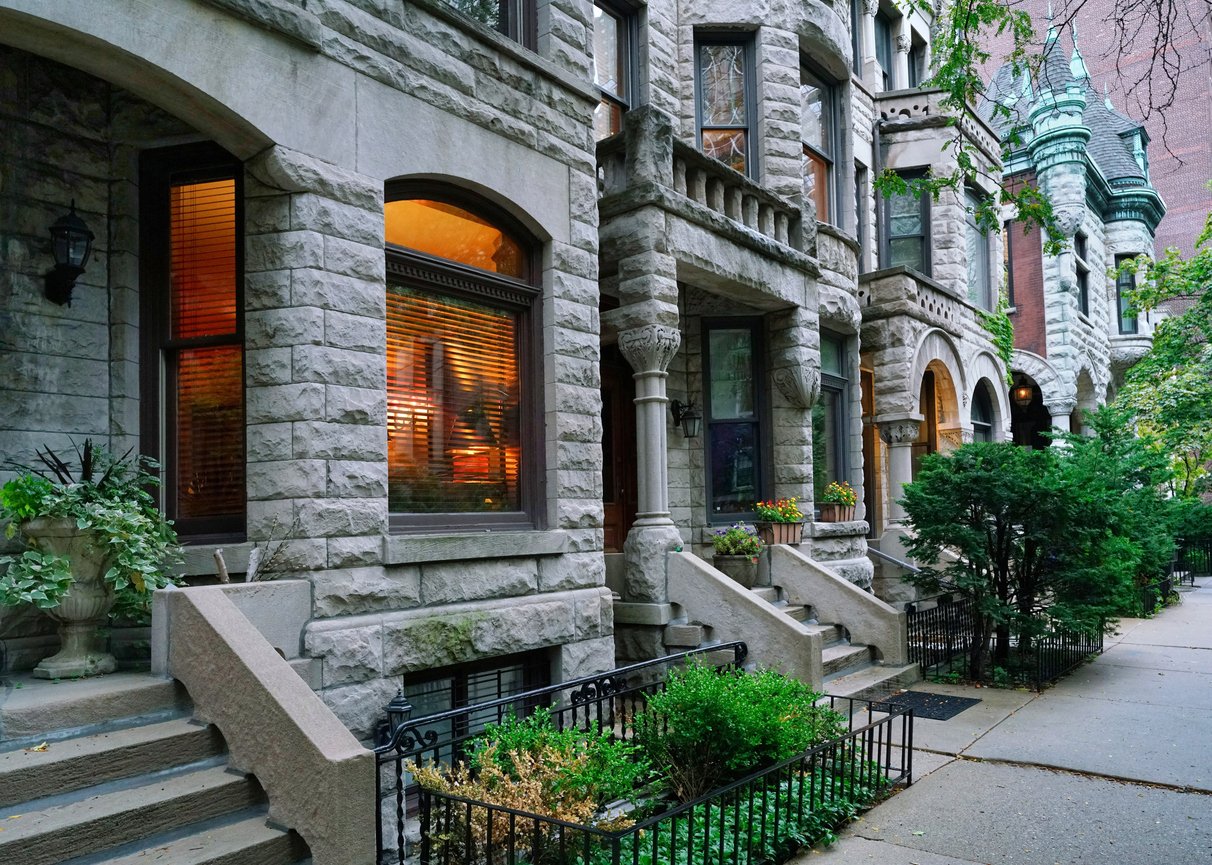
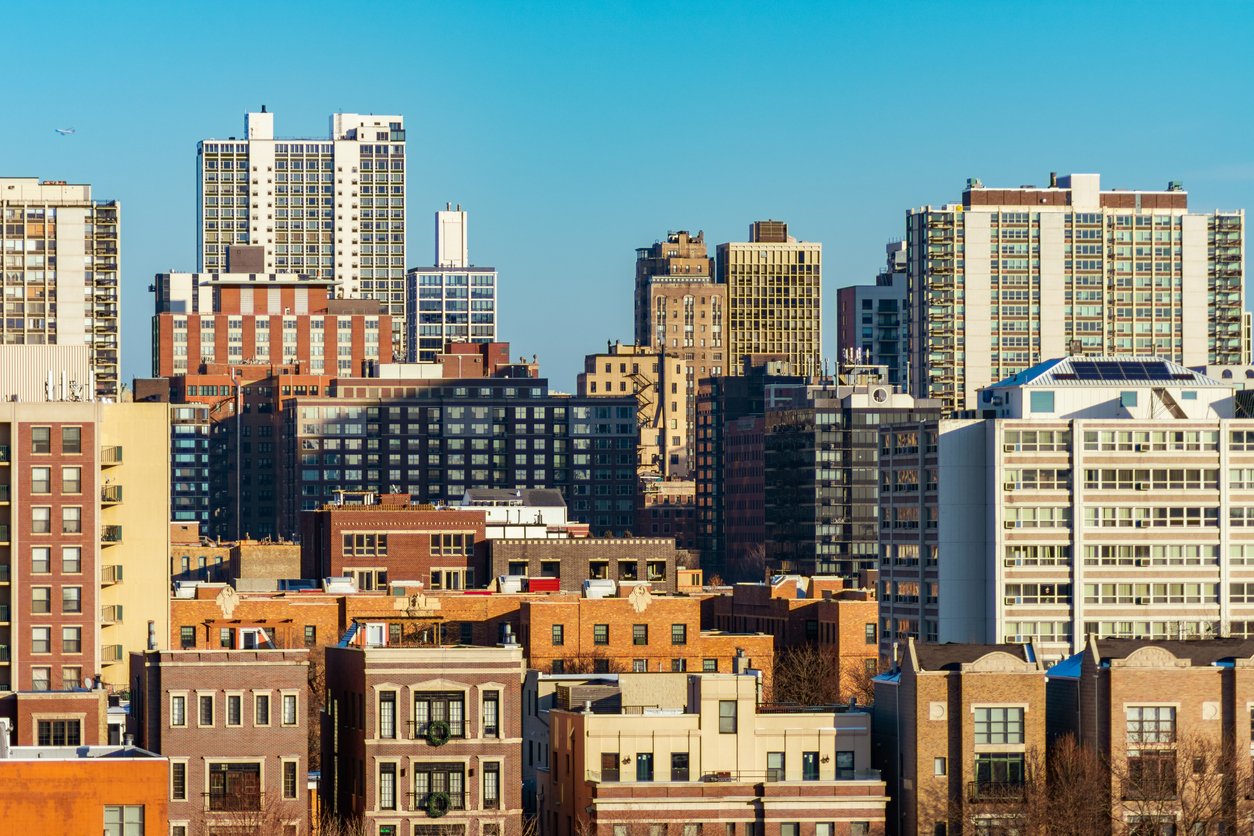
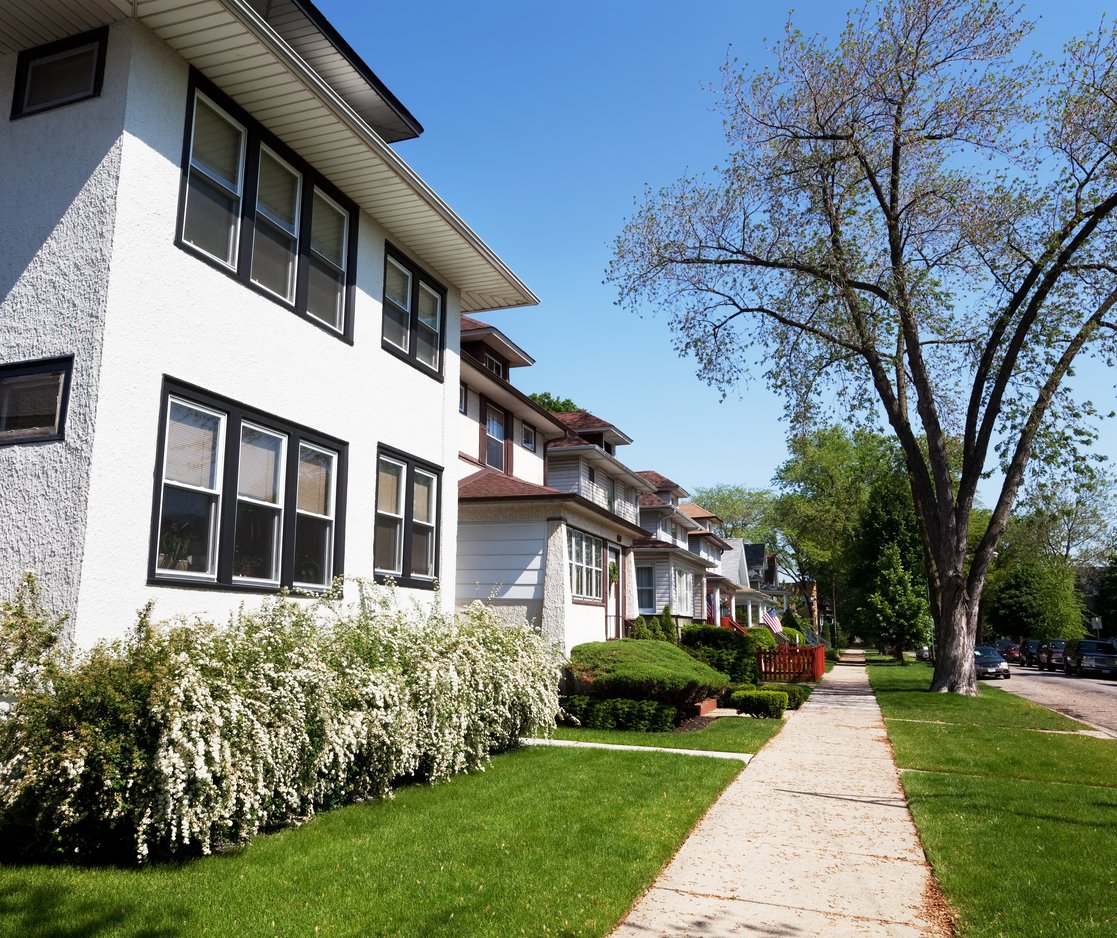
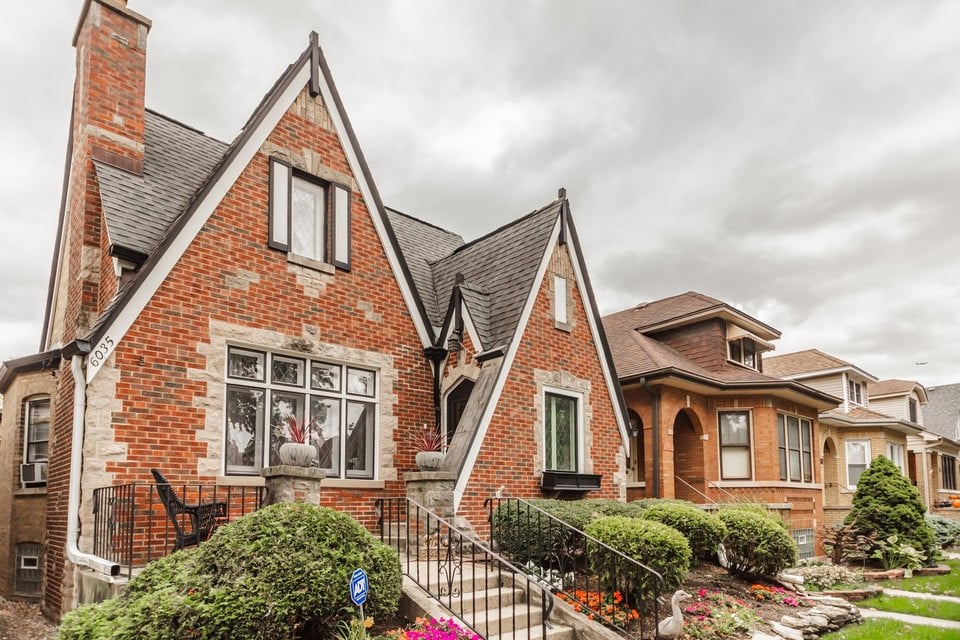
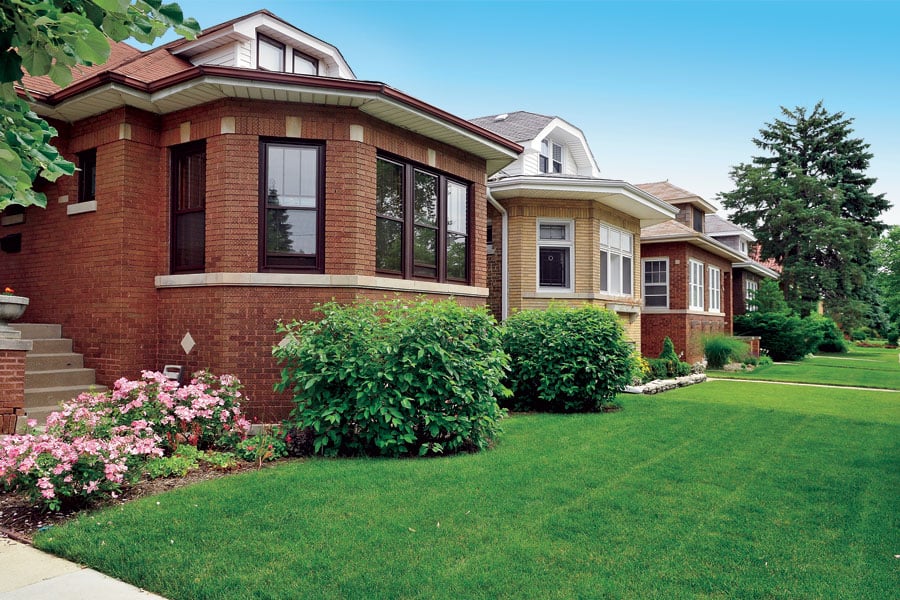
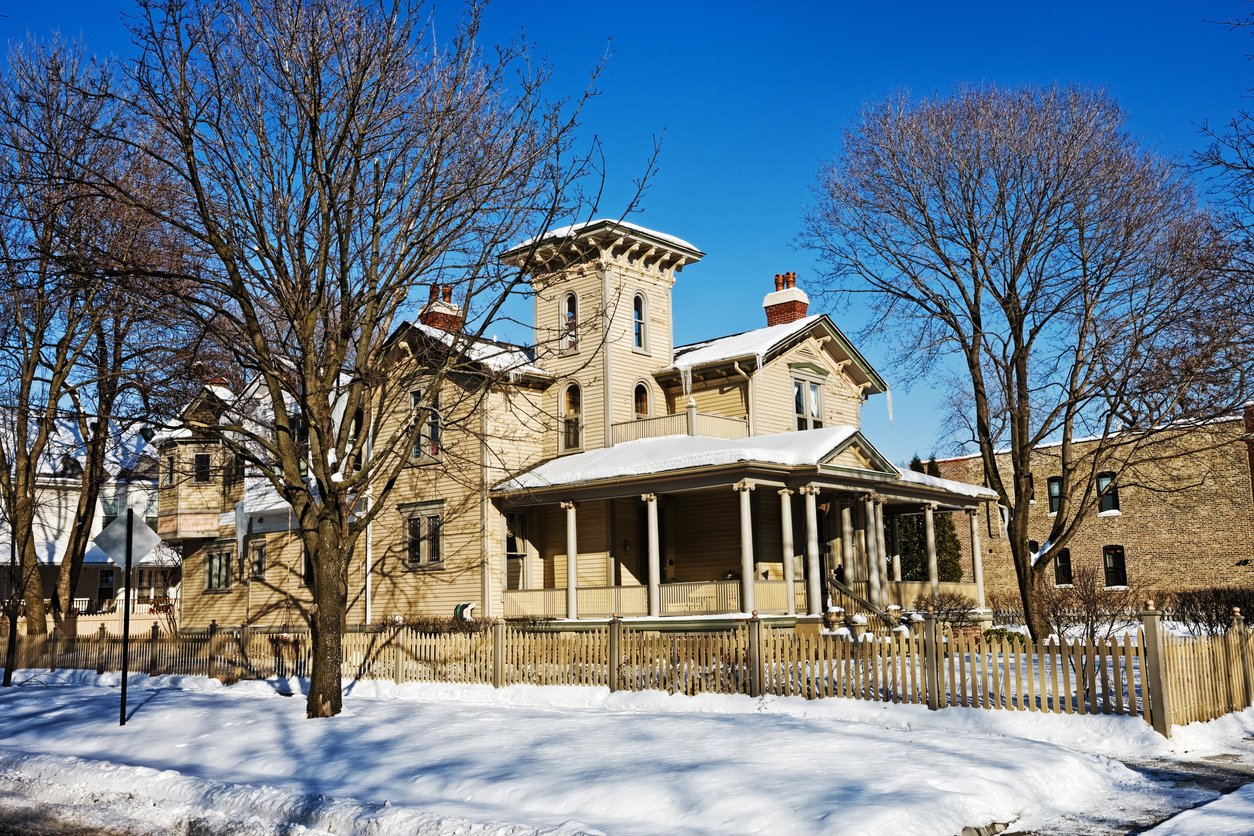
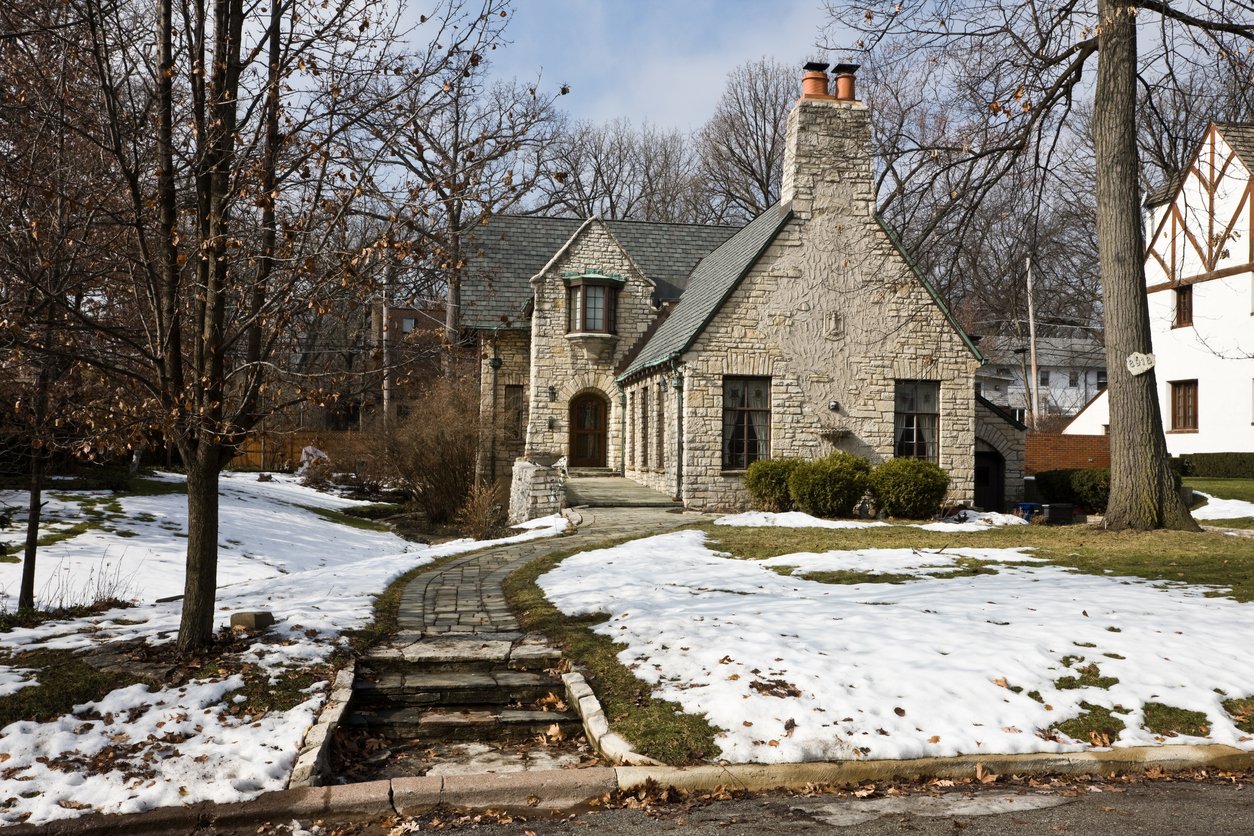
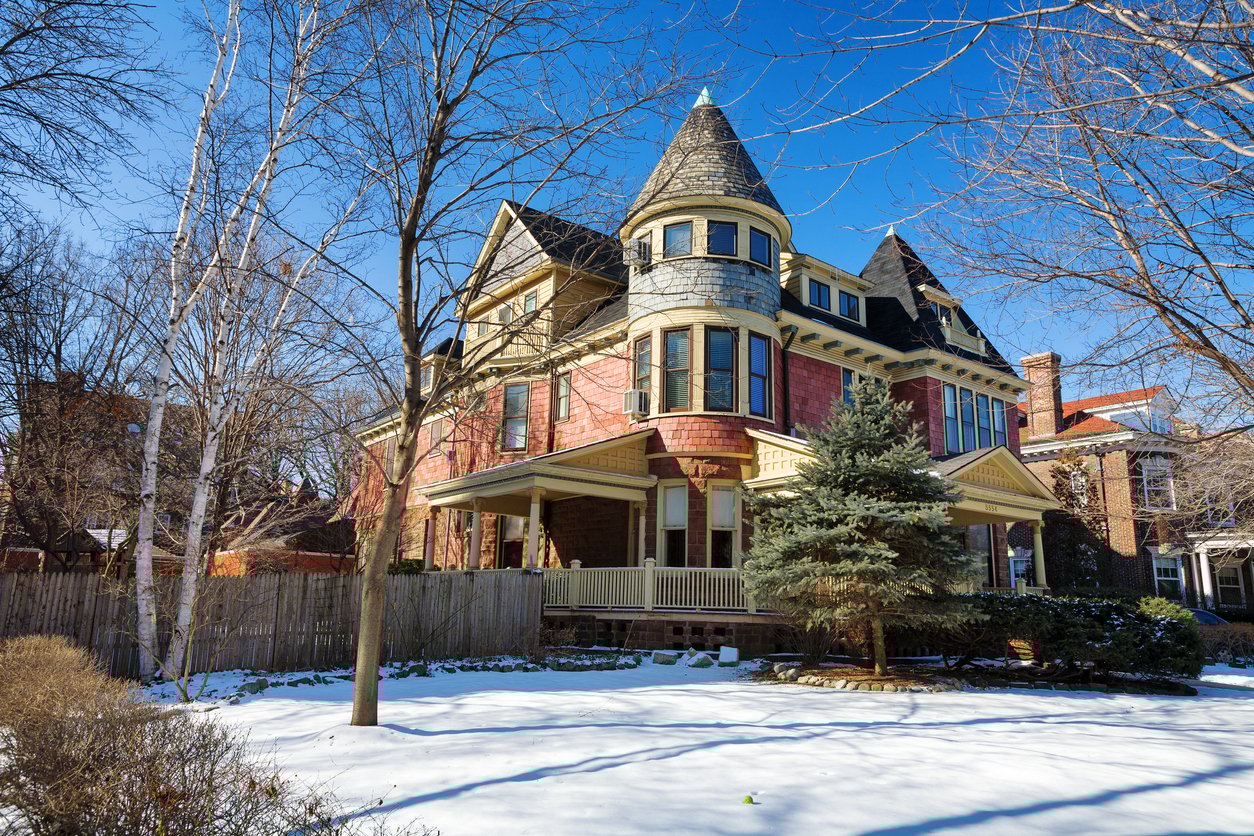
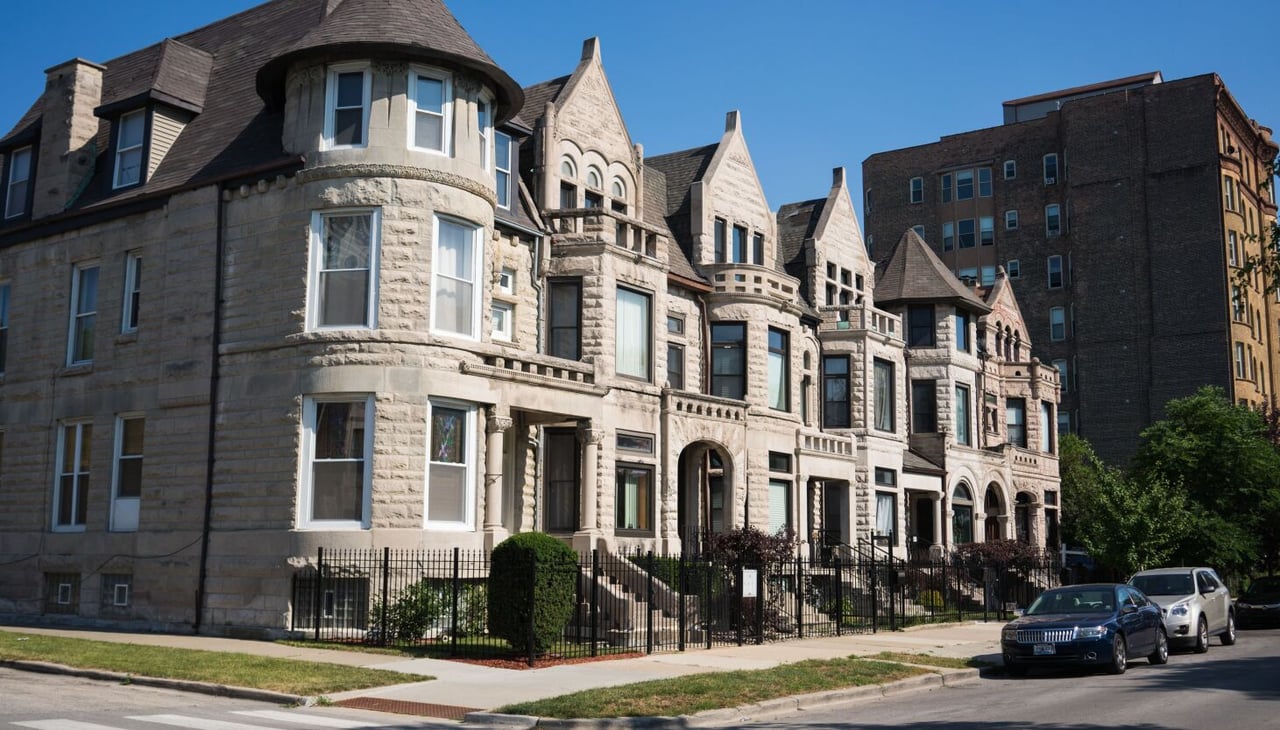
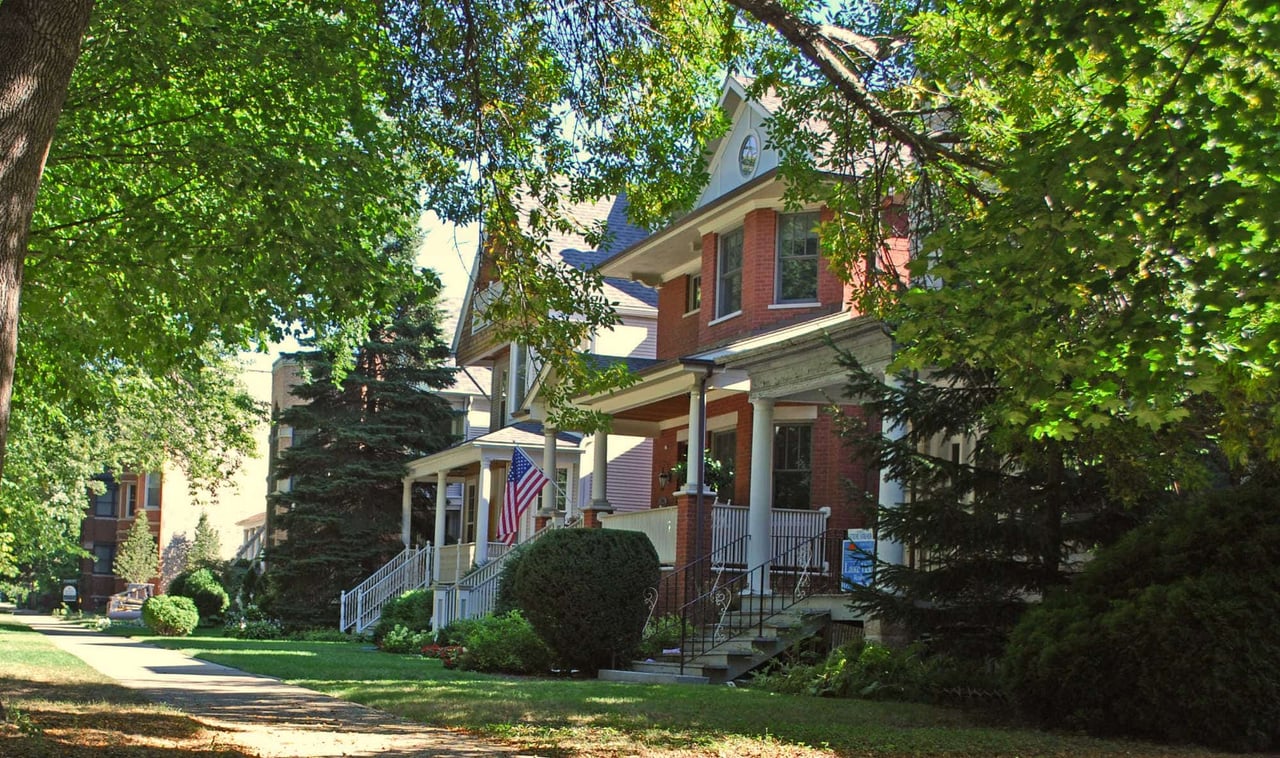
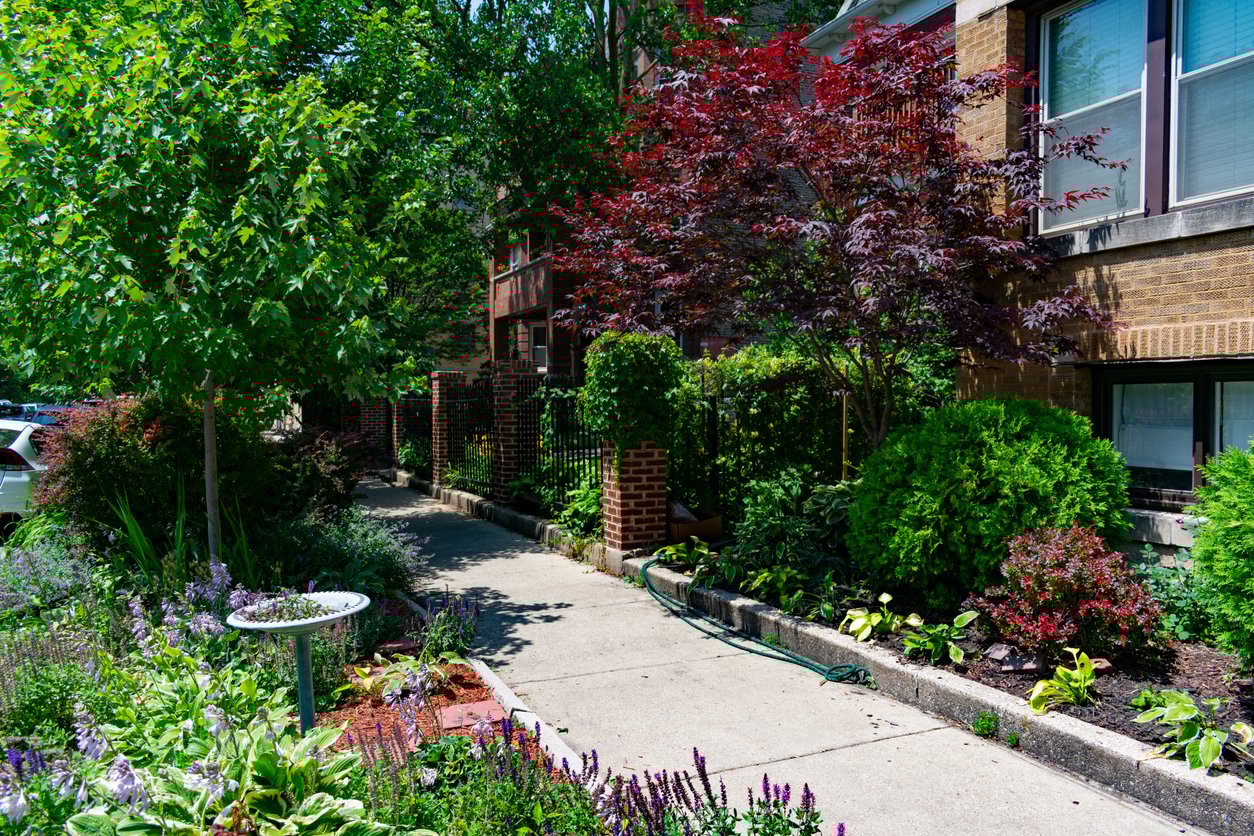
The neighborhood was built along the West Side's grand boulevard system, and that legacy shows in its housing: historic greystones, brick two-flats, and rowhouses line Washington and Warren Boulevards and the surrounding streets, much of it dating to the early 1900s. Renovation and new construction activity continues to add to the housing stock alongside the vintage buildings.
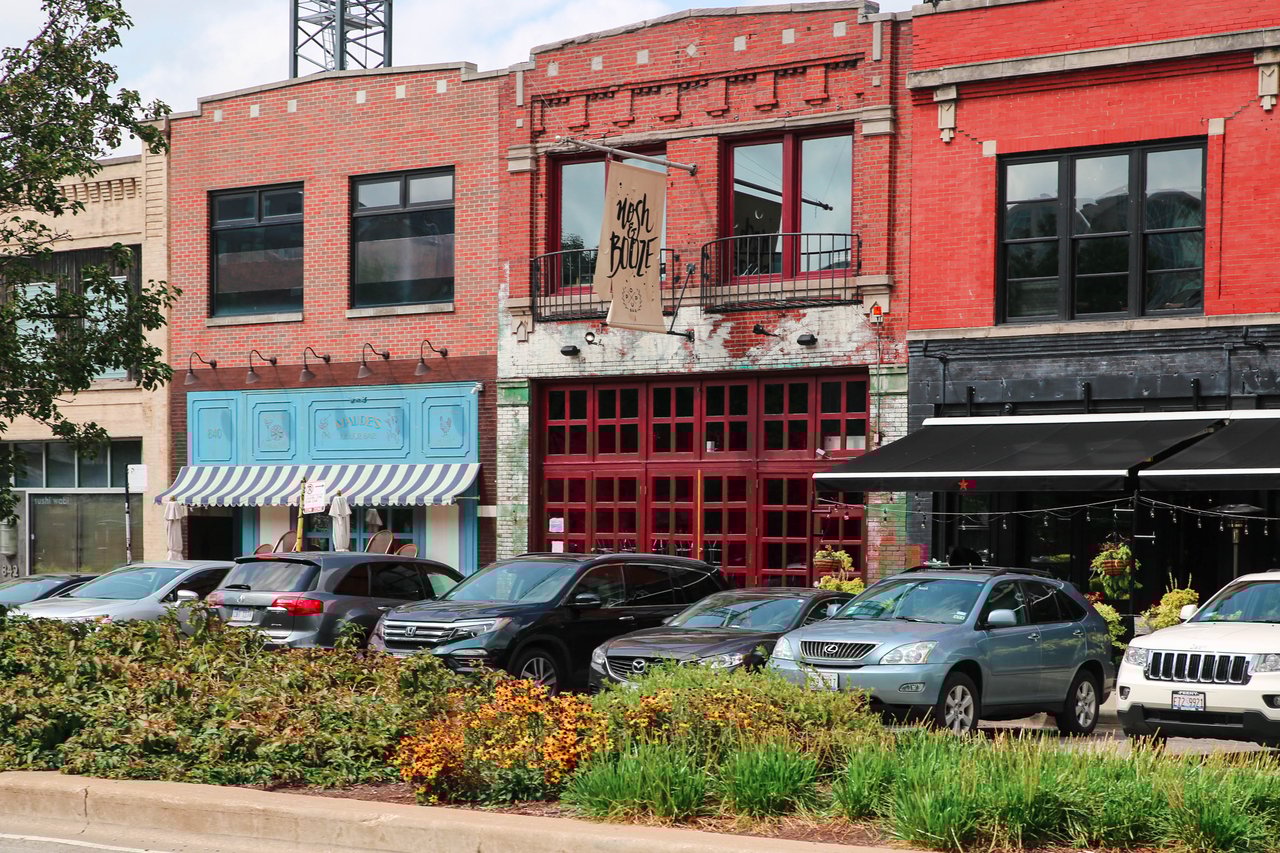
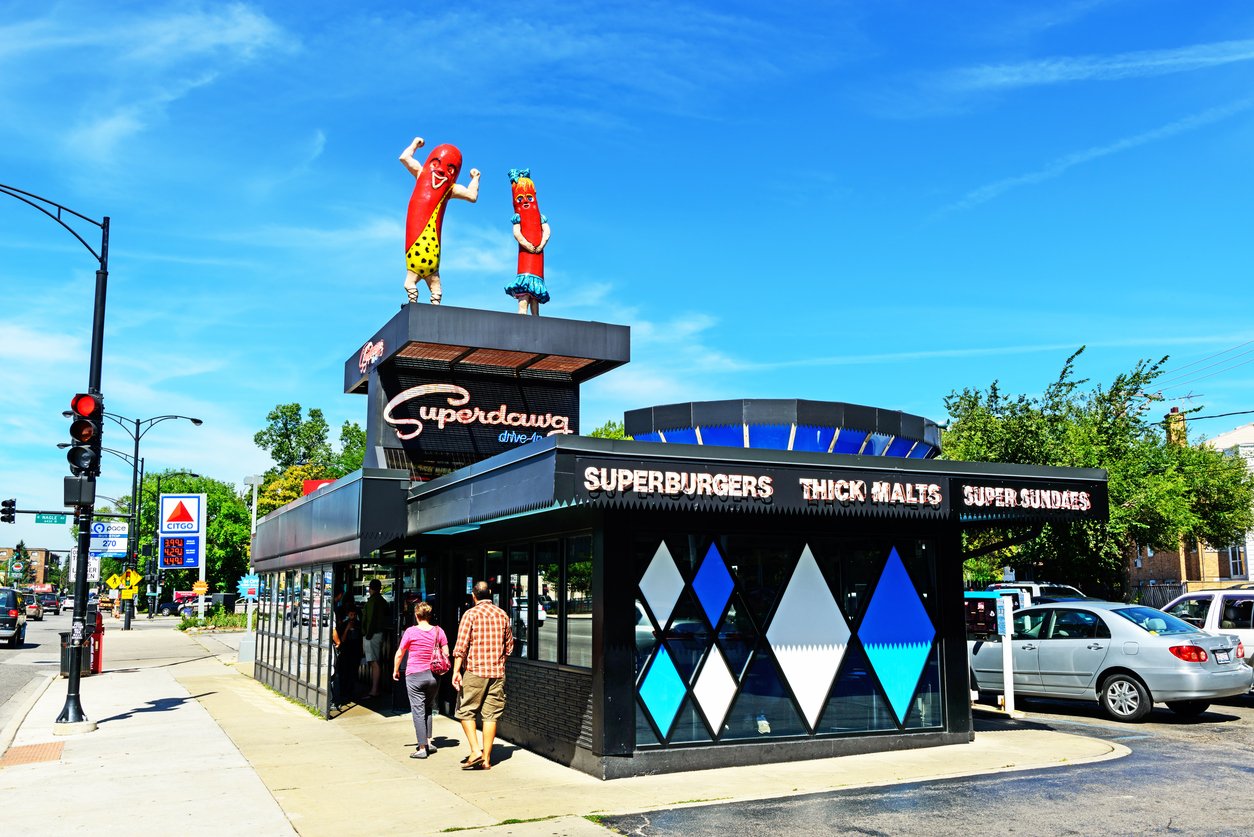
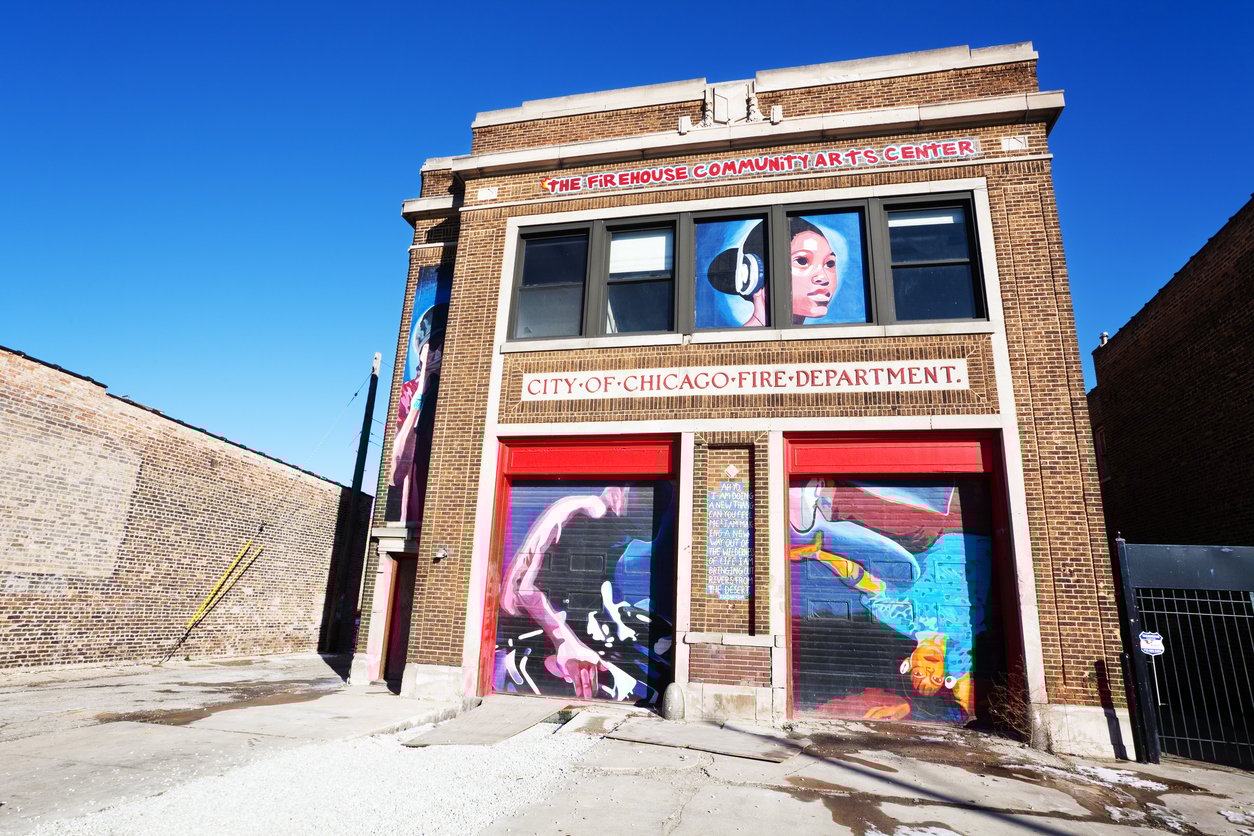
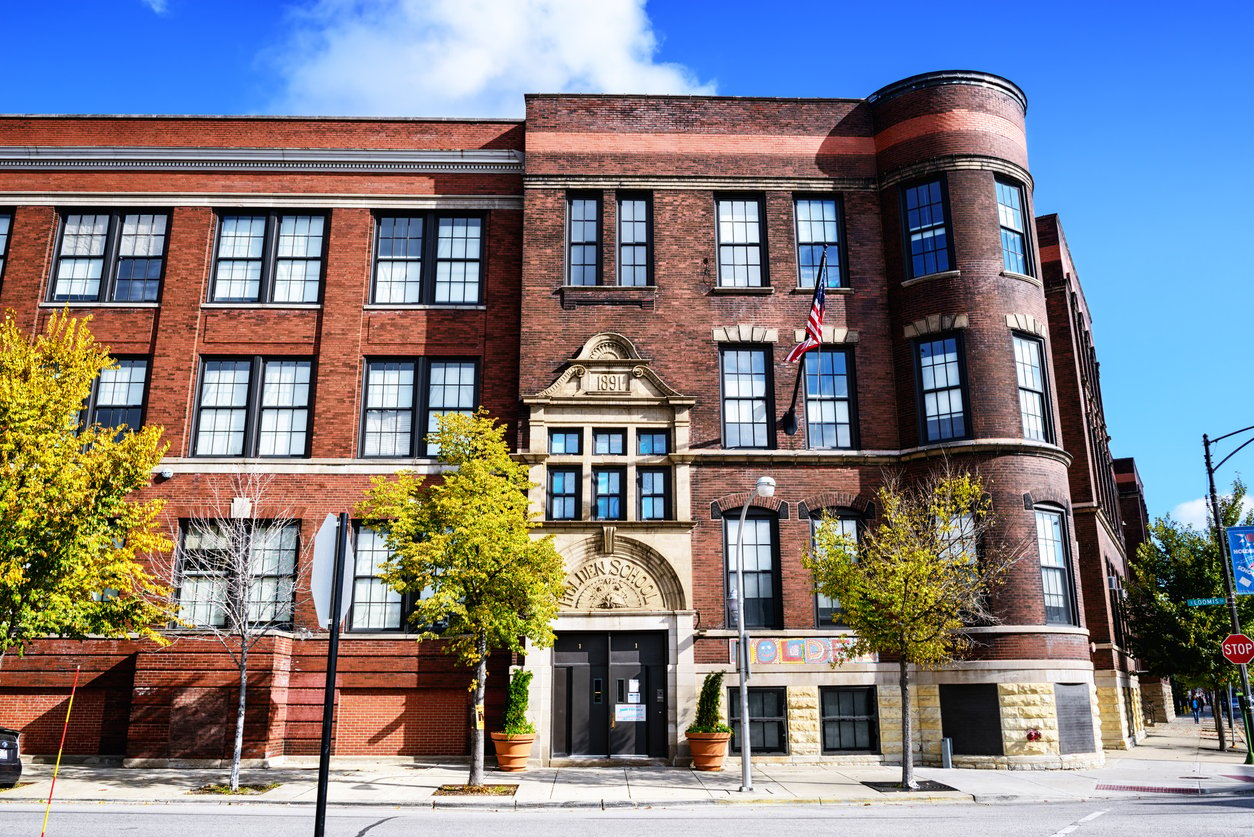
Institutions are part of the neighborhood's present tense. The Hatchery, a food-business incubator at Lake and Kedzie, supports dozens of local food entrepreneurs; the Conservatory's events calendar runs year-round; and the neighborhood sits minutes from the United Center, the Illinois Medical District, and the Kinzie industrial corridor's employers.
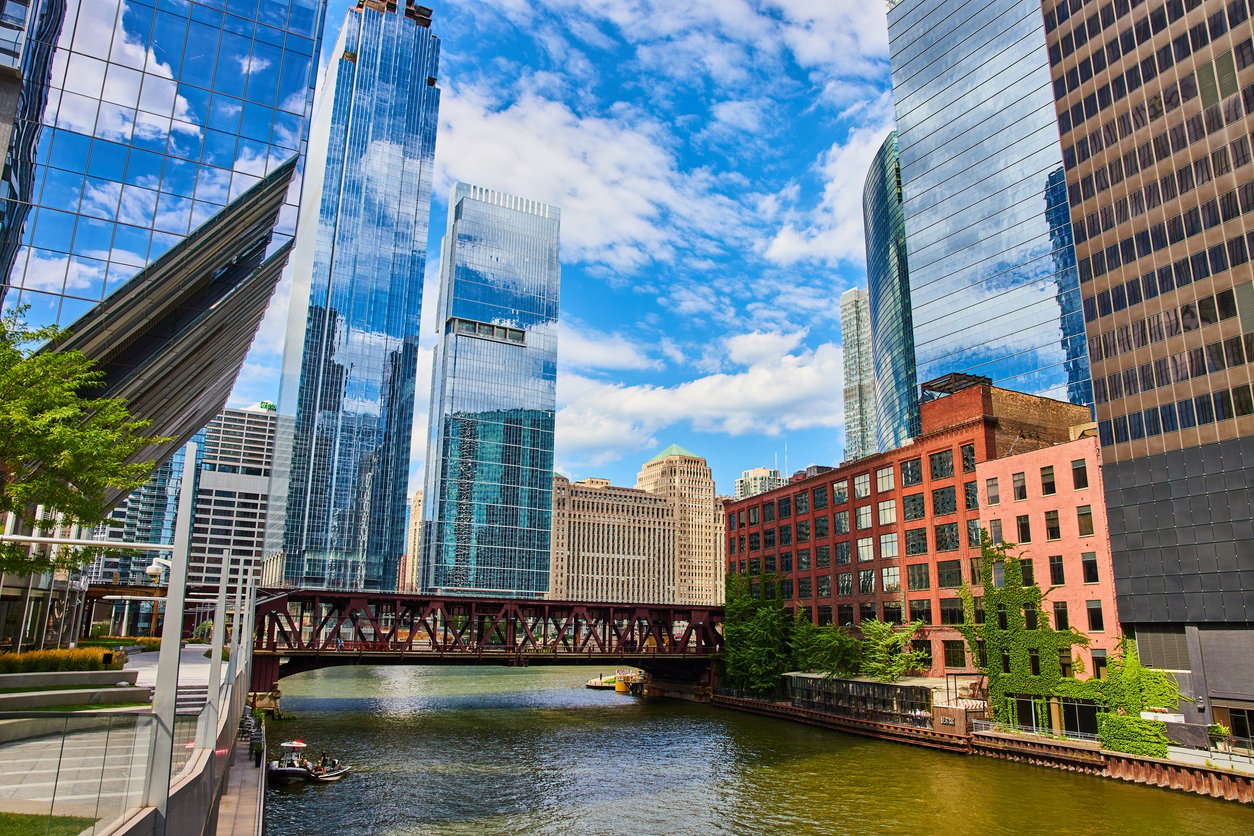
Transit access is direct: the Green Line stops at Conservatory–Central Park Drive and Kedzie, reaching the Loop in about 15 minutes, the Blue Line runs along the Eisenhower at the neighborhood's southern edge, and buses cover Madison, Lake, and Kedzie.
East Garfield Park offers landmark parkland, historic boulevard architecture, and quick Green Line access — with greystones and two-flats that carry the West Side's building tradition.
Do you need a car in East Garfield Park?
Not necessarily — the Green Line reaches the Loop in about 15 minutes from the Conservatory and Kedzie stops, the Blue Line runs along the southern edge, and buses cover the main streets. Many residents keep a car, and parking is easy.
What is the Garfield Park Conservatory?
One of the largest conservatories in the nation — acres of plants under historic glass houses, including the Palm House and Fern Room — located inside Garfield Park. Admission is free, and it draws visitors from across the city.
What types of homes are in East Garfield Park?
Historic greystones, brick two-flats, and rowhouses along the boulevards and side streets, alongside renovated buildings and new construction.
How close is East Garfield Park to downtown?
About 15 minutes on the Green Line, with the United Center and the Illinois Medical District even closer. The Eisenhower and Lake Street provide direct routes for drivers.
20,526 people live in East Garfield Park, where the median age is 34 and the average individual income is $24,616. Data provided by the U.S. Census Bureau.
Total Population
Median Age
Population Density
Average individual Income
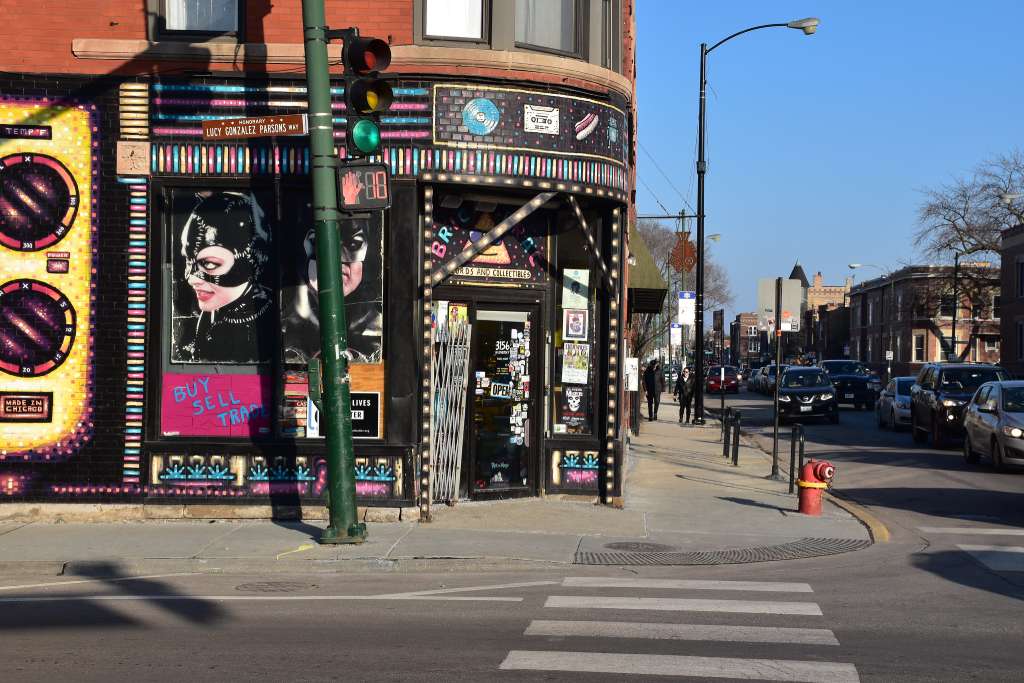
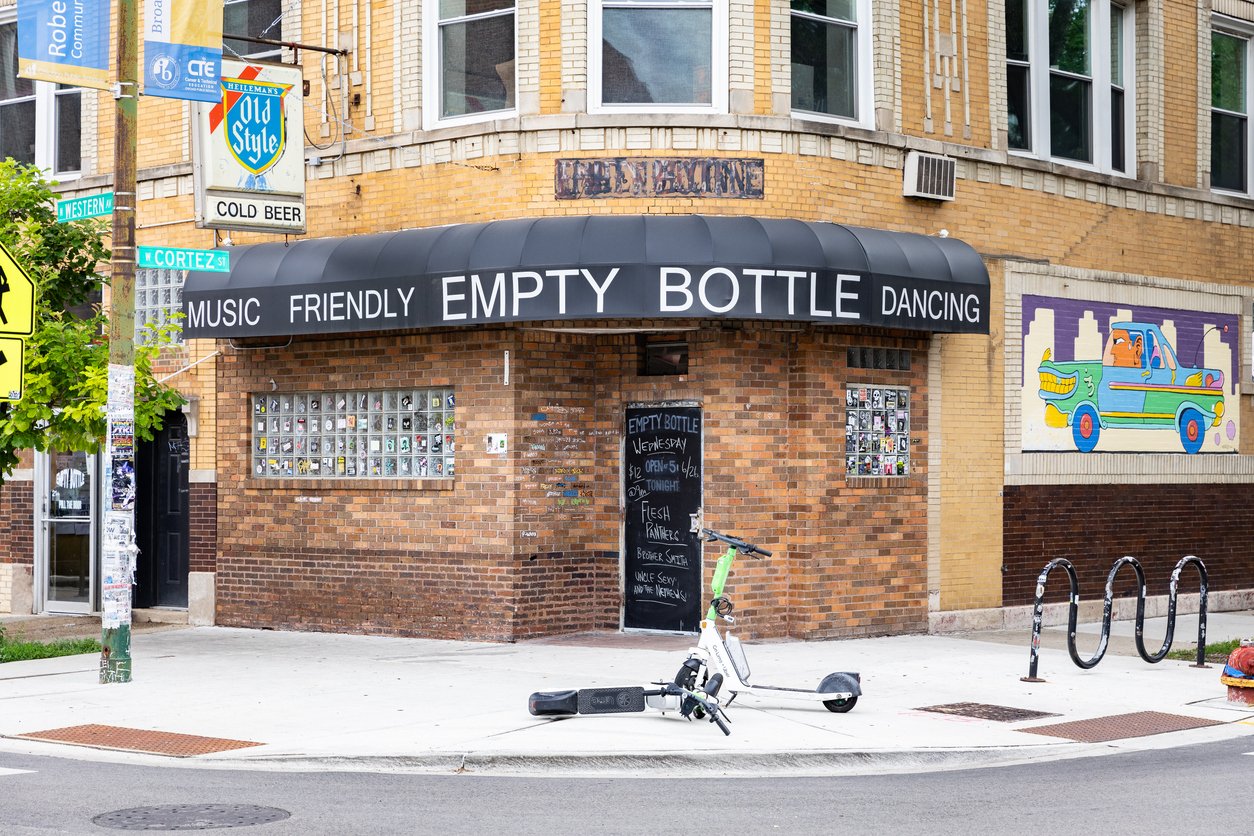
There's plenty to do around East Garfield Park, including shopping, dining, nightlife, parks, and more. Data provided by Walk Score and Yelp.
Explore popular things to do in the area, including Port Center Cafe, Giorgio Armani, and Moirai Health & Fitness.
| Name | Category | Distance | Reviews |
Ratings by
Yelp
|
|---|---|---|---|---|
| Dining · $$ | 2.84 miles | 13 reviews | 4.3/5 stars | |
| Shopping | 4.32 miles | 7 reviews | 4.7/5 stars | |
| Active | 3.2 miles | 6 reviews | 5/5 stars | |
| Active | 4.01 miles | 7 reviews | 5/5 stars | |
| Active | 4.09 miles | 7 reviews | 5/5 stars | |
| Active | 4.63 miles | 6 reviews | 4.7/5 stars | |
| Active | 2.38 miles | 2 reviews | 5/5 stars | |
| Nightlife | 4.59 miles | 7 reviews | 4.3/5 stars | |
| Beauty | 4.81 miles | 14 reviews | 5/5 stars | |
| Beauty | 4.56 miles | 15 reviews | 4.9/5 stars | |
| Beauty | 4.45 miles | 10 reviews | 4.9/5 stars | |
| Beauty | 4.01 miles | 30 reviews | 4.9/5 stars | |
| Beauty | 3.78 miles | 4 reviews | 5/5 stars | |
| Beauty | 4.71 miles | 12 reviews | 4.7/5 stars | |
| Beauty | 4.73 miles | 3 reviews | 5/5 stars | |
| Beauty | 2.13 miles | 4 reviews | 4.8/5 stars | |
| Beauty | 4.55 miles | 7 reviews | 4.4/5 stars | |
|
|
||||
|
|
||||
|
|
||||
|
|
||||
|
|
||||
|
|
East Garfield Park has 7,737 households, with an average household size of 3. Data provided by the U.S. Census Bureau. Here’s what the people living in East Garfield Park do for work — and how long it takes them to get there. Data provided by the U.S. Census Bureau. 20,526 people call East Garfield Park home. The population density is 14,325 and the largest age group is Data provided by the U.S. Census Bureau.
Total Population
Population Density Population Density This is the number of people per square mile in a neighborhood.
Median Age
Men vs Women
Population by Age Group
0-9 Years
10-17 Years
18-24 Years
25-64 Years
65-74 Years
75+ Years
Education Level
Total Households
Average Household Size
Average individual Income
Households with Children
With Children:
Without Children:
Blue vs White Collar Workers
Blue Collar:
White Collar:

1875 N DAMEN AVE CHICAGO IL 60647
1875 N DAMEN AVE CHICAGO IL 60647